

Filtering the Noise: A Focused Brew on Layer 1 Networks
Beyond the Hype: What the Data Says About the Big Blockchain Cafés

Alright Brew Crew,
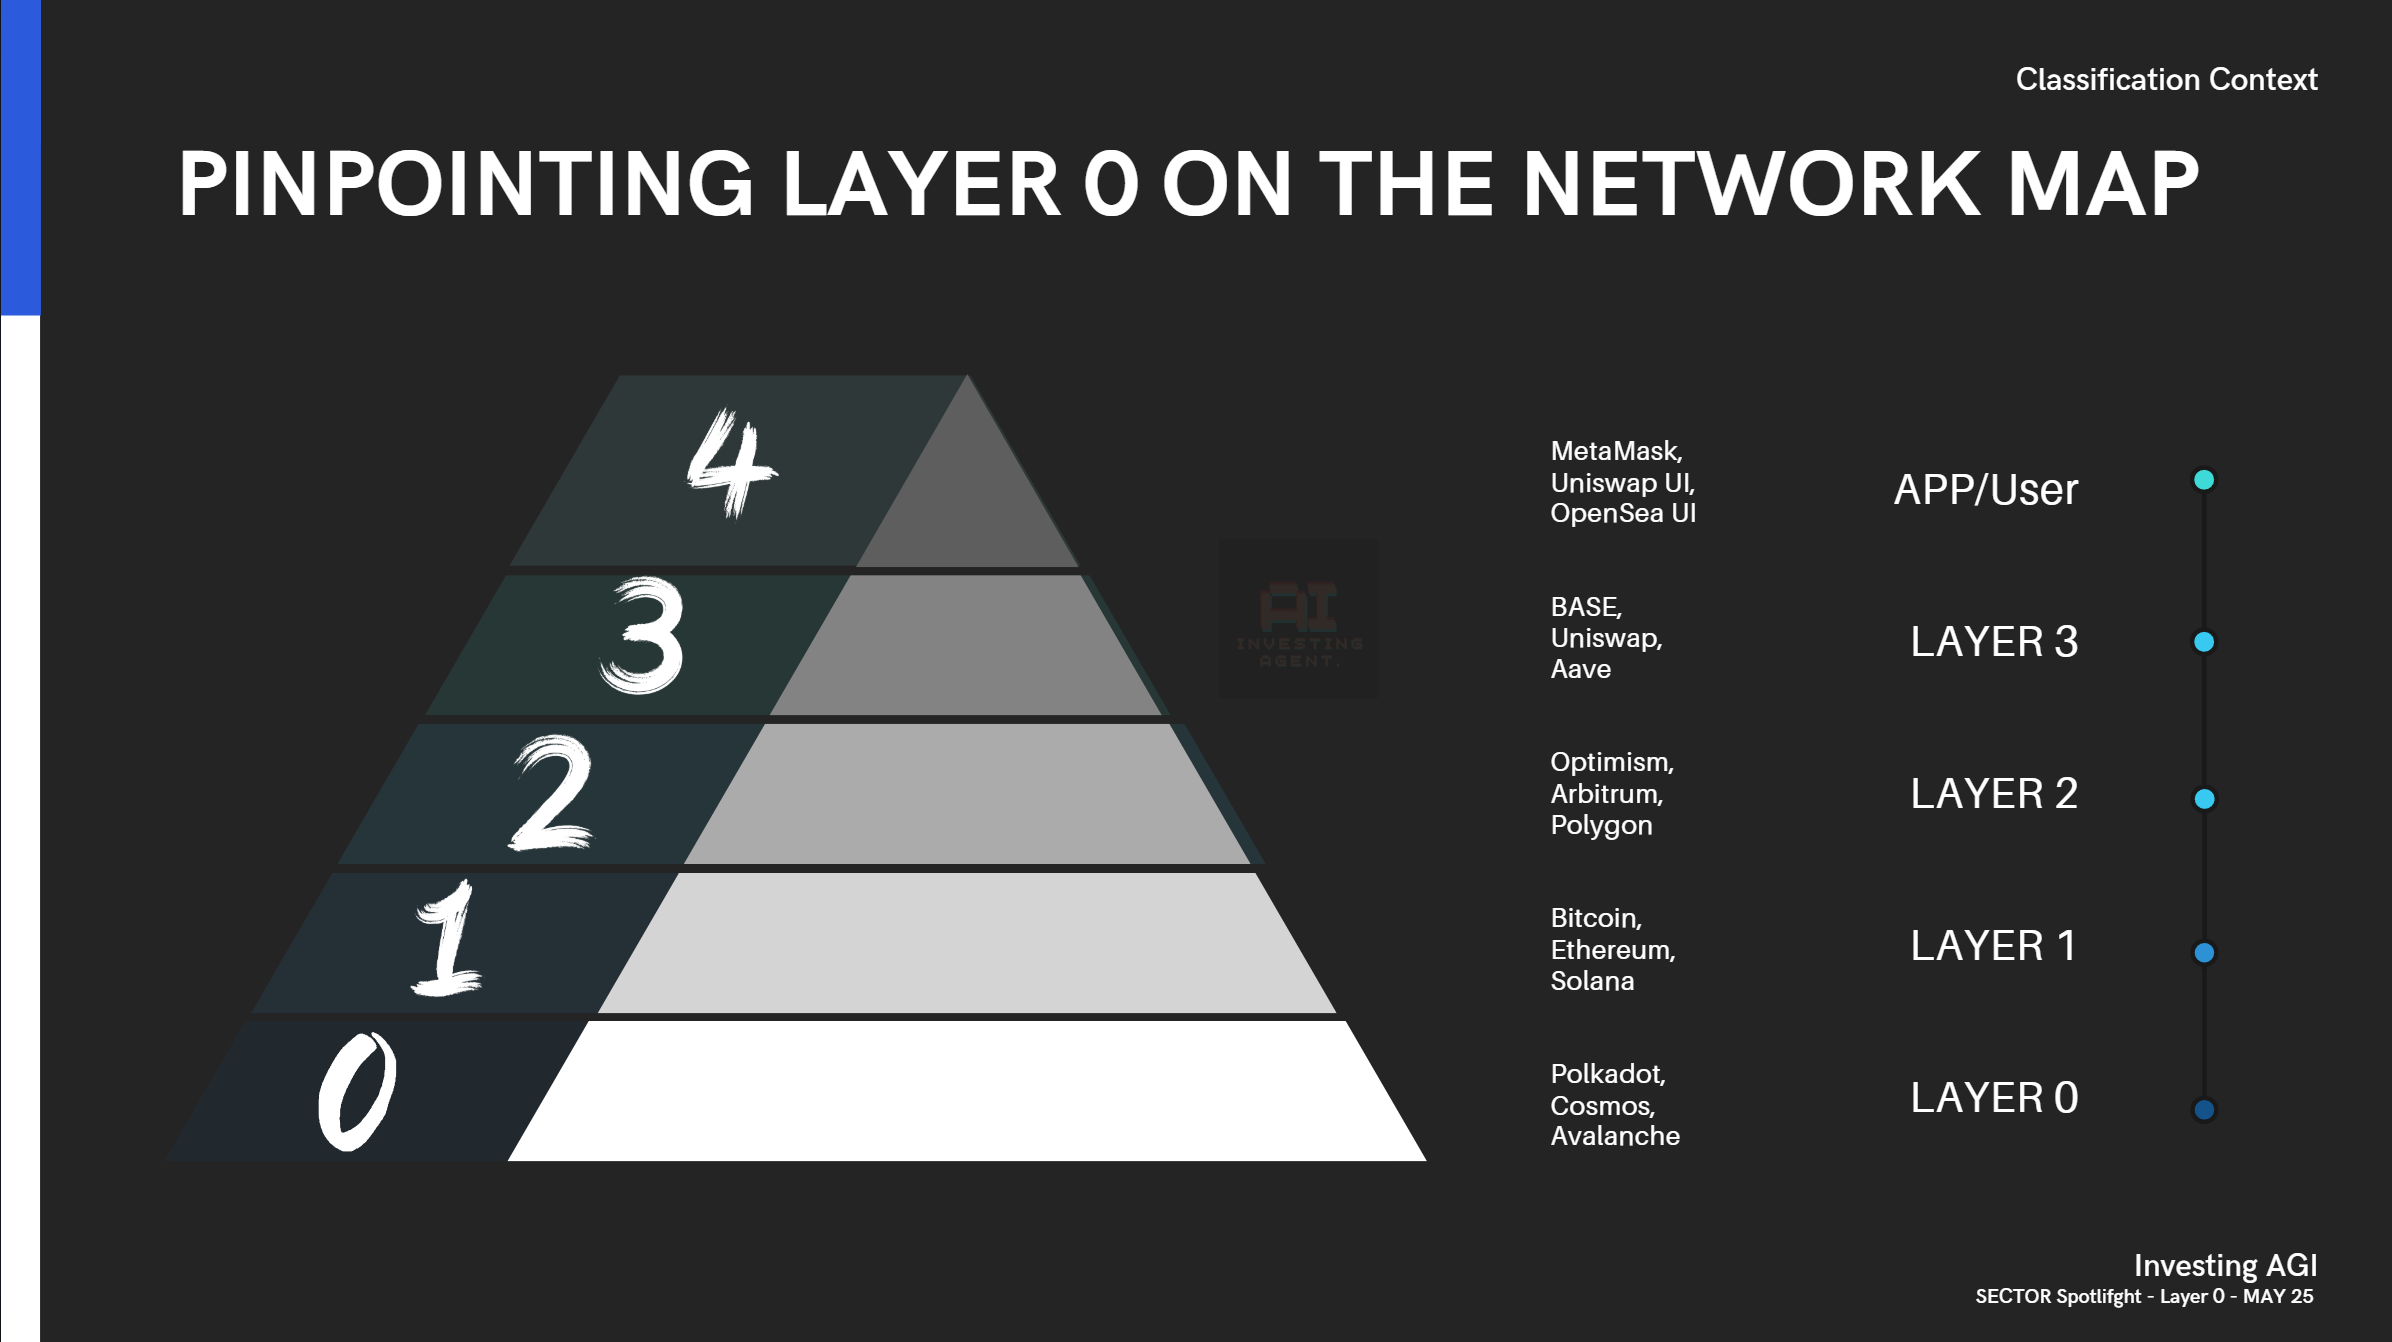
Last time, we explored the essential, yet often unseen, Layer 0 plumbing. Today, we're moving up a level to the main floor – the Layer 1 networks. These are the foundational blockchains themselves, the grand public squares or the flagship coffee shop chains where most of the on-chain action happens. Think Bitcoin, Ethereum, Solana, Cardano – the big names that host entire ecosystems of applications and users.
In our B.E.A.N.S. classification system, Layer 1s are the primary examples within the Networks Major Category and often define their own Layer-1 Sector (though some L1s also function as Layer 0s, like Avalanche). They are the core 'regions' or 'processing methods' in our crypto coffee map, each with its unique consensus mechanism (how they agree on orders), smart contract capabilities (the complexity of drinks they can serve), and transaction speeds (how fast the queue moves).
The Layer 1 space is notoriously noisy. It's where Sentiment-Driven Chaos often reigns supreme, Community Tribalism runs rampant ("My blockchain café is better than yours!"), and discerning real Utility from vaporware requires serious analysis. That's why we fire up our AI Roastery and data filters – to cut through the hype and deliver a focused brew based on what the market data actually shows.
Let's dive into the market view for these major blockchain cafés, using the snapshot from your May 2025 research deck.
Market View: Checking the Pulse of the Main Cafés (May 2025 Snapshot)
How are these foundational blockchains performing in the market arena? Here’s what our filtered data brew reveals:
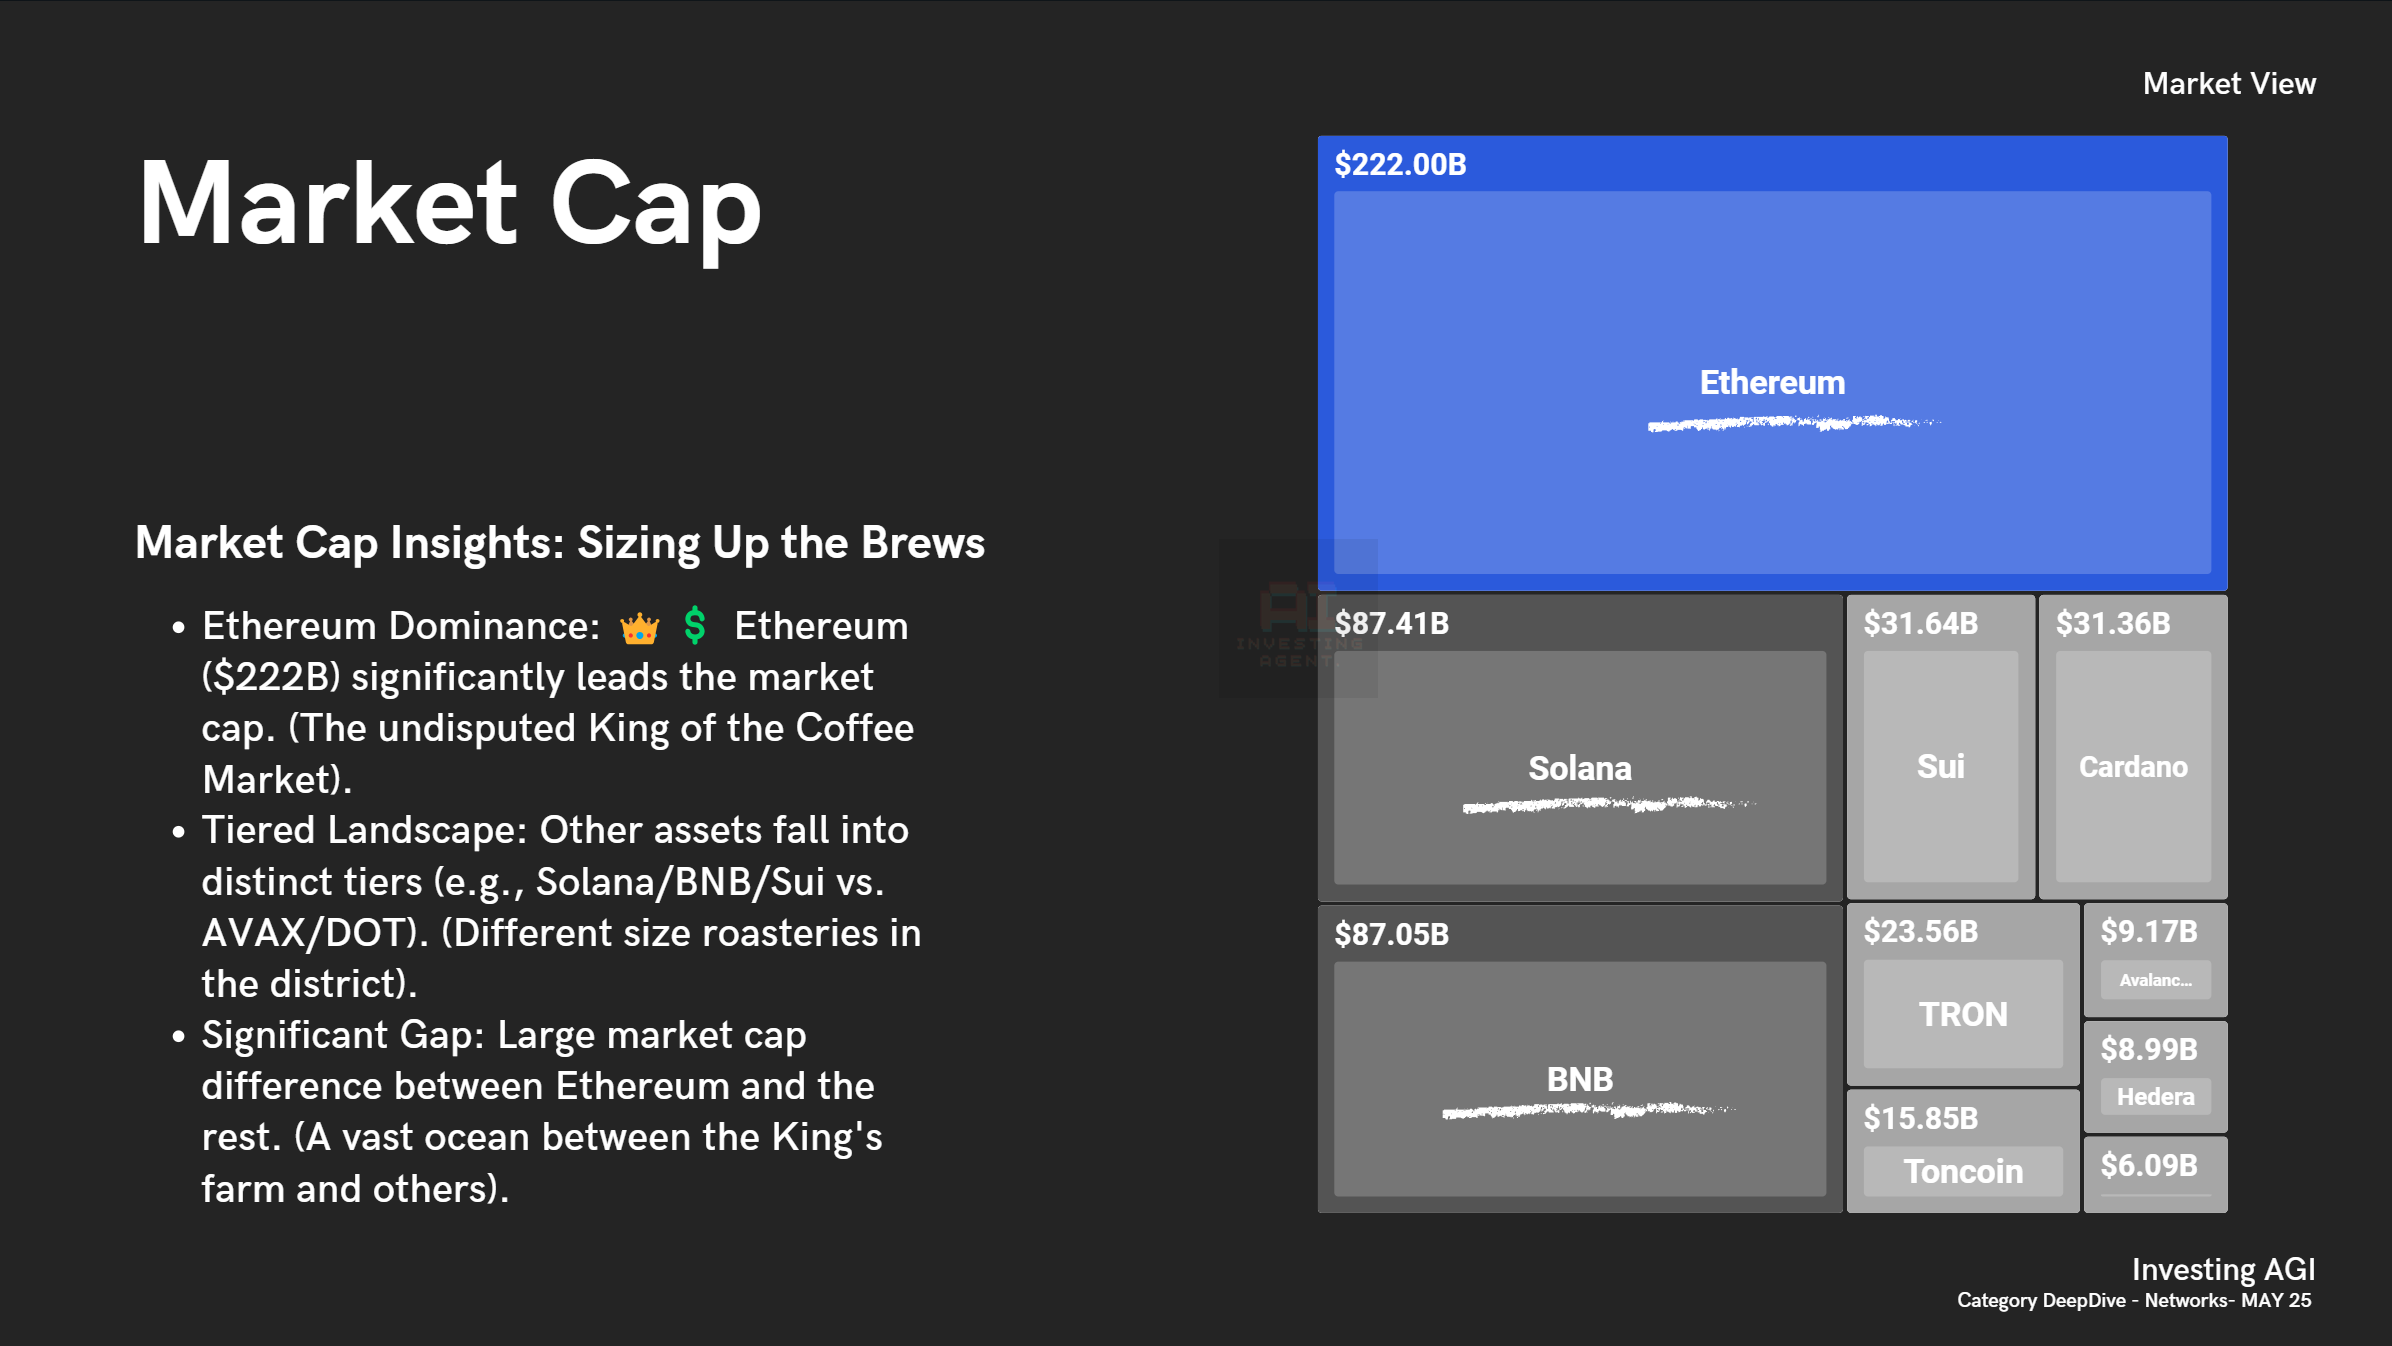
1. Market Cap: Sizing Up the Coffee Empires
Market Cap gives us the overall valuation – how big the market perceives these Layer 1 'coffee empires' to be.
Ethereum's Reign: There's no contest here. Ethereum (ETH) at $222B market cap (as of May '25) was the undisputed 'King of the Coffee Market', dwarfing all others.
Clear Tiers Emerge: Below the king, distinct tiers formed. Solana (SOL) and BNB were in a league around $87B, followed by Sui and Cardano (ADA) around $31B, then TRON, Toncoin, Avalanche (AVAX), Hedera (HBAR), and Polkadot (DOT) further down. It's like comparing a global coffee conglomerate to national chains and regional roasteries.
The Vast Moat: The gap between Ethereum and the next tier was enormous – a 'vast ocean between the King's farm and others', highlighting ETH's dominant network effect and market confidence at that time.
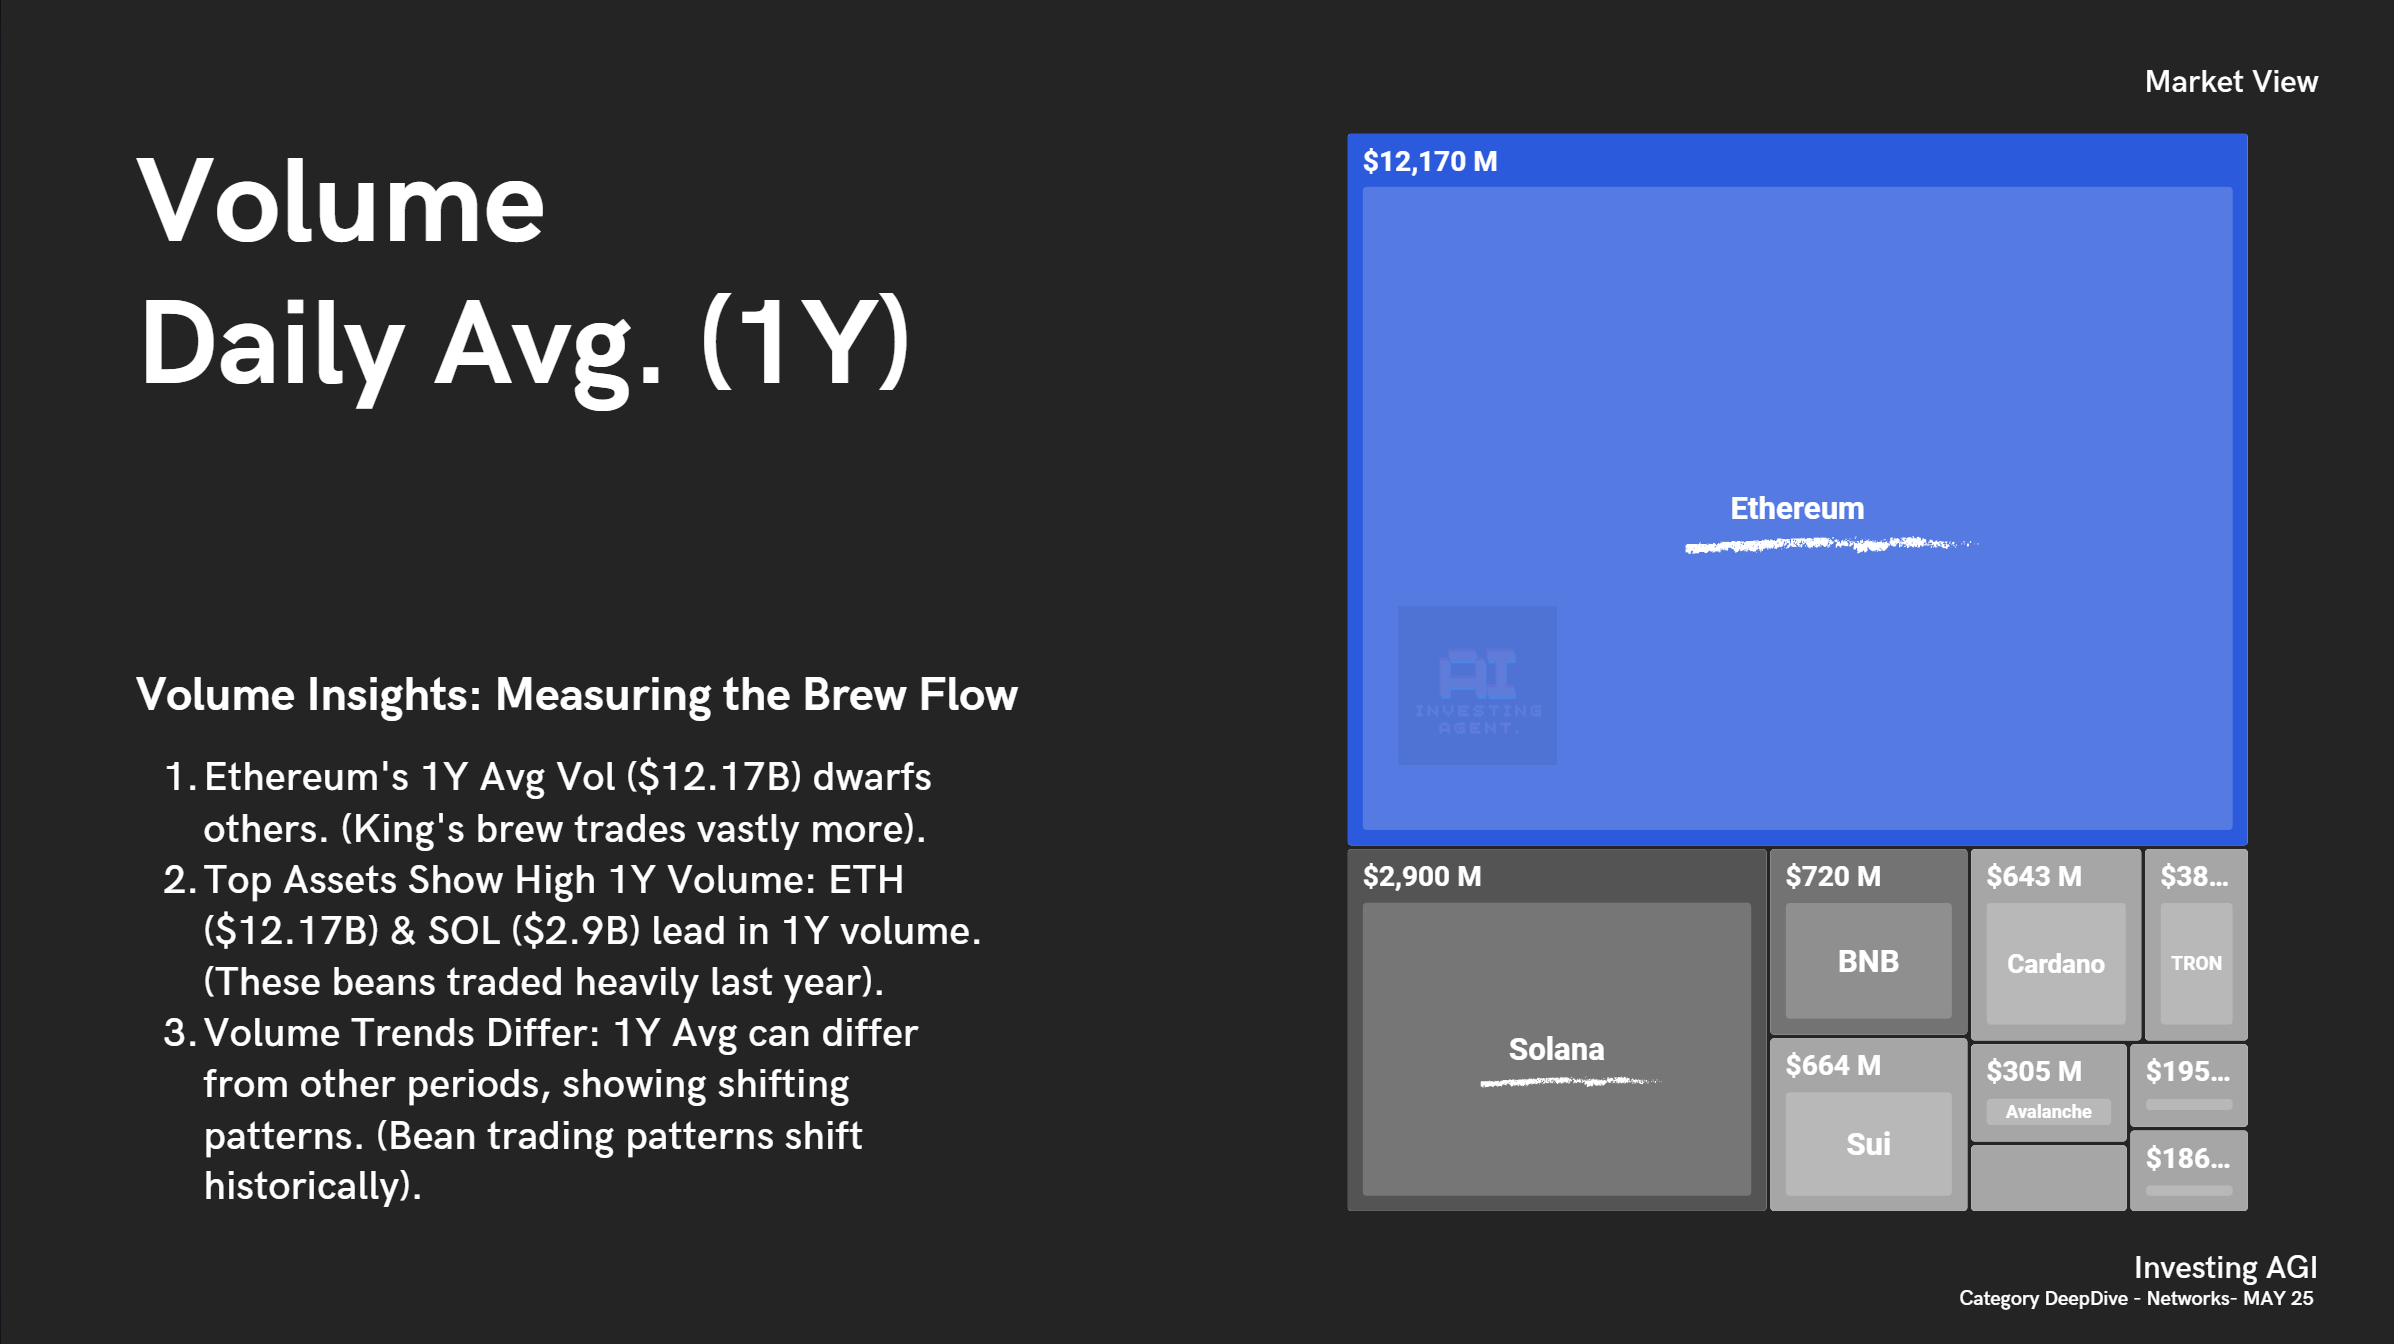
2. Volume (Daily Avg. 1Y): How Much Coffee is Actually Being Traded?
1-Year Average Daily Volume shows the sustained trading interest and liquidity over a longer period.
Ethereum's Trading Dominance: ETH's 1-year average daily volume ($12.17B) absolutely dwarfed everyone else. The 'King's brew trades vastly more' than any competitor.
Top Tier Activity: Solana ($2.9B 1Y avg) was the clear number two in sustained trading interest, indicating these two 'beans traded heavily last year'.
Shifting Patterns: It's noted that 1-year averages can differ from shorter-term views, reminding us that 'bean trading patterns shift historically'. What was hot last year might not be today.
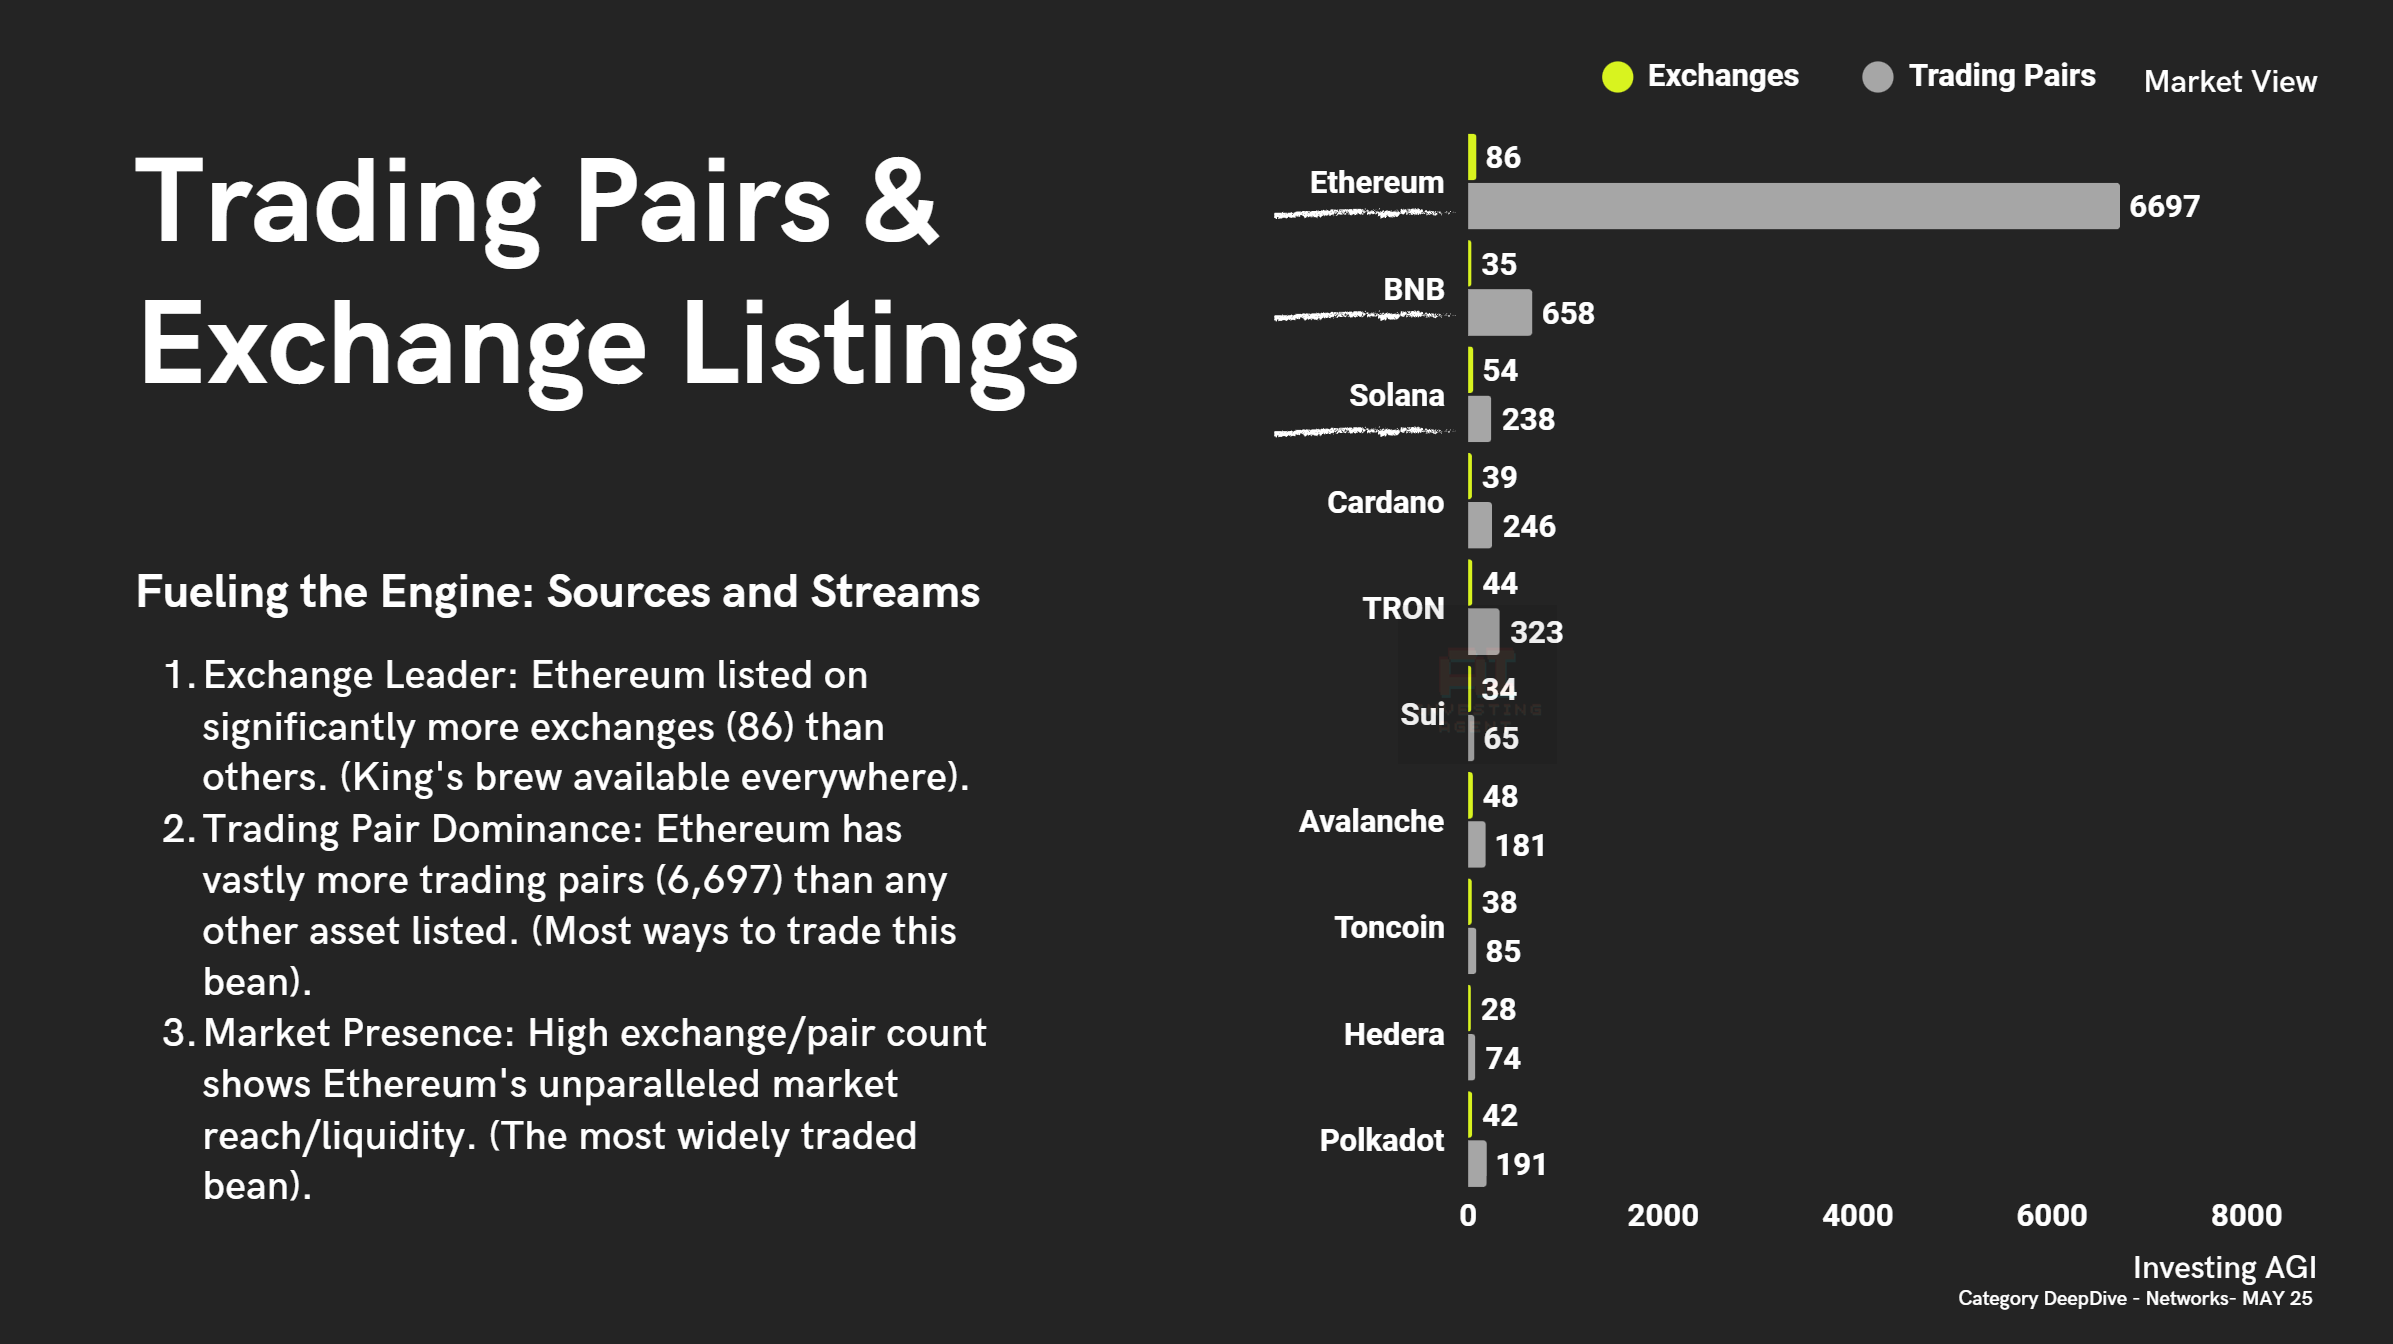
3. Trading Pairs & Exchange Listings: Where Can You Get These Brews?
This metric shows market access and integration – how easy is it to buy, sell, and trade these Layer 1 assets?
Ethereum Everywhere: ETH boasted listings on significantly more exchanges (86) than any other L1 listed. The 'King's brew is available everywhere'.
Unmatched Trading Options: With a staggering 6,697 trading pairs, Ethereum offered the most ways to trade by far. It's the 'most widely traded bean', period.
Market Reach = Liquidity: This unparalleled exchange presence and trading pair count underscored Ethereum's deep market integration and liquidity, making it the easiest L1 token to move in and out of.
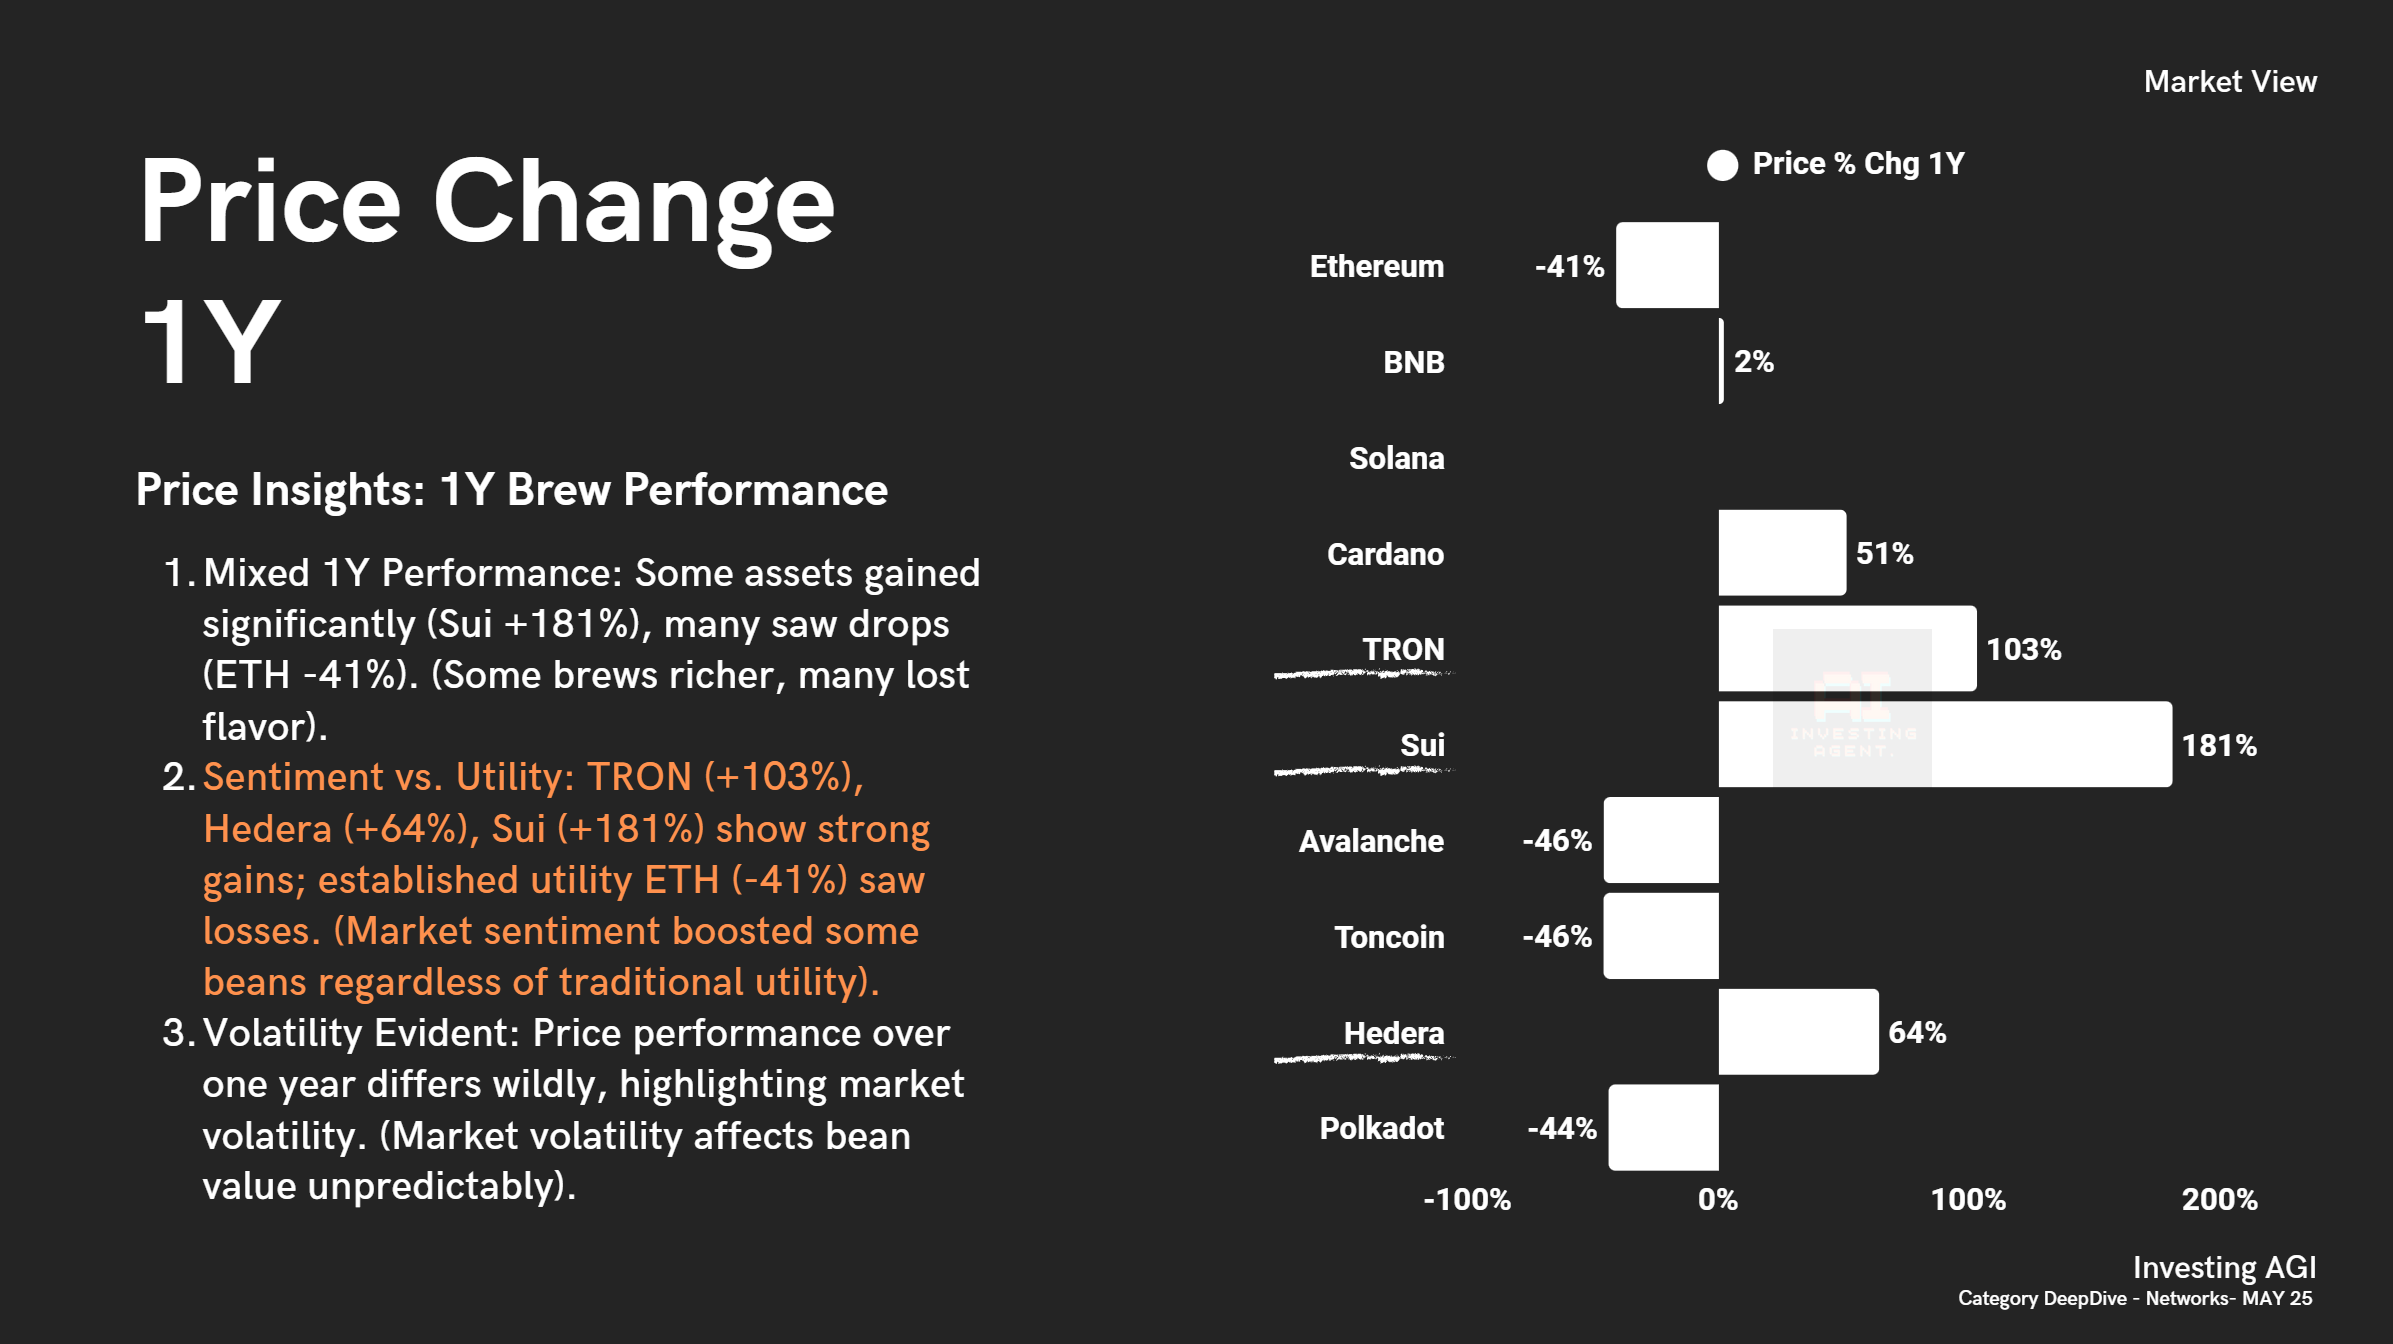
4. Price Change (1Y): How Did the Brew Taste Over the Last Year?
Looking at the 1-year price change (leading up to May 2025) reveals performance and market sentiment shifts.
A Mixed Bag of Flavors: Performance was all over the map. Some assets saw incredible gains (Sui +181%, TRON +103%, Hedera +64%), while many established players saw significant drops (ETH -41%, Cardano -51%, Avalanche -46%, Polkadot -44%). 'Some brews got richer, many lost flavor'.
Sentiment vs. Utility?: An interesting observation was that assets like TRON, Hedera, and Sui showed strong gains, while ETH, often cited for its utility, saw losses during that specific period. This hints that 'market sentiment boosted some beans regardless of traditional utility' in that timeframe.
Volatility is King: The wild divergence in performance highlighted the extreme volatility inherent in the crypto market. 'Market volatility affects bean value unpredictably'.
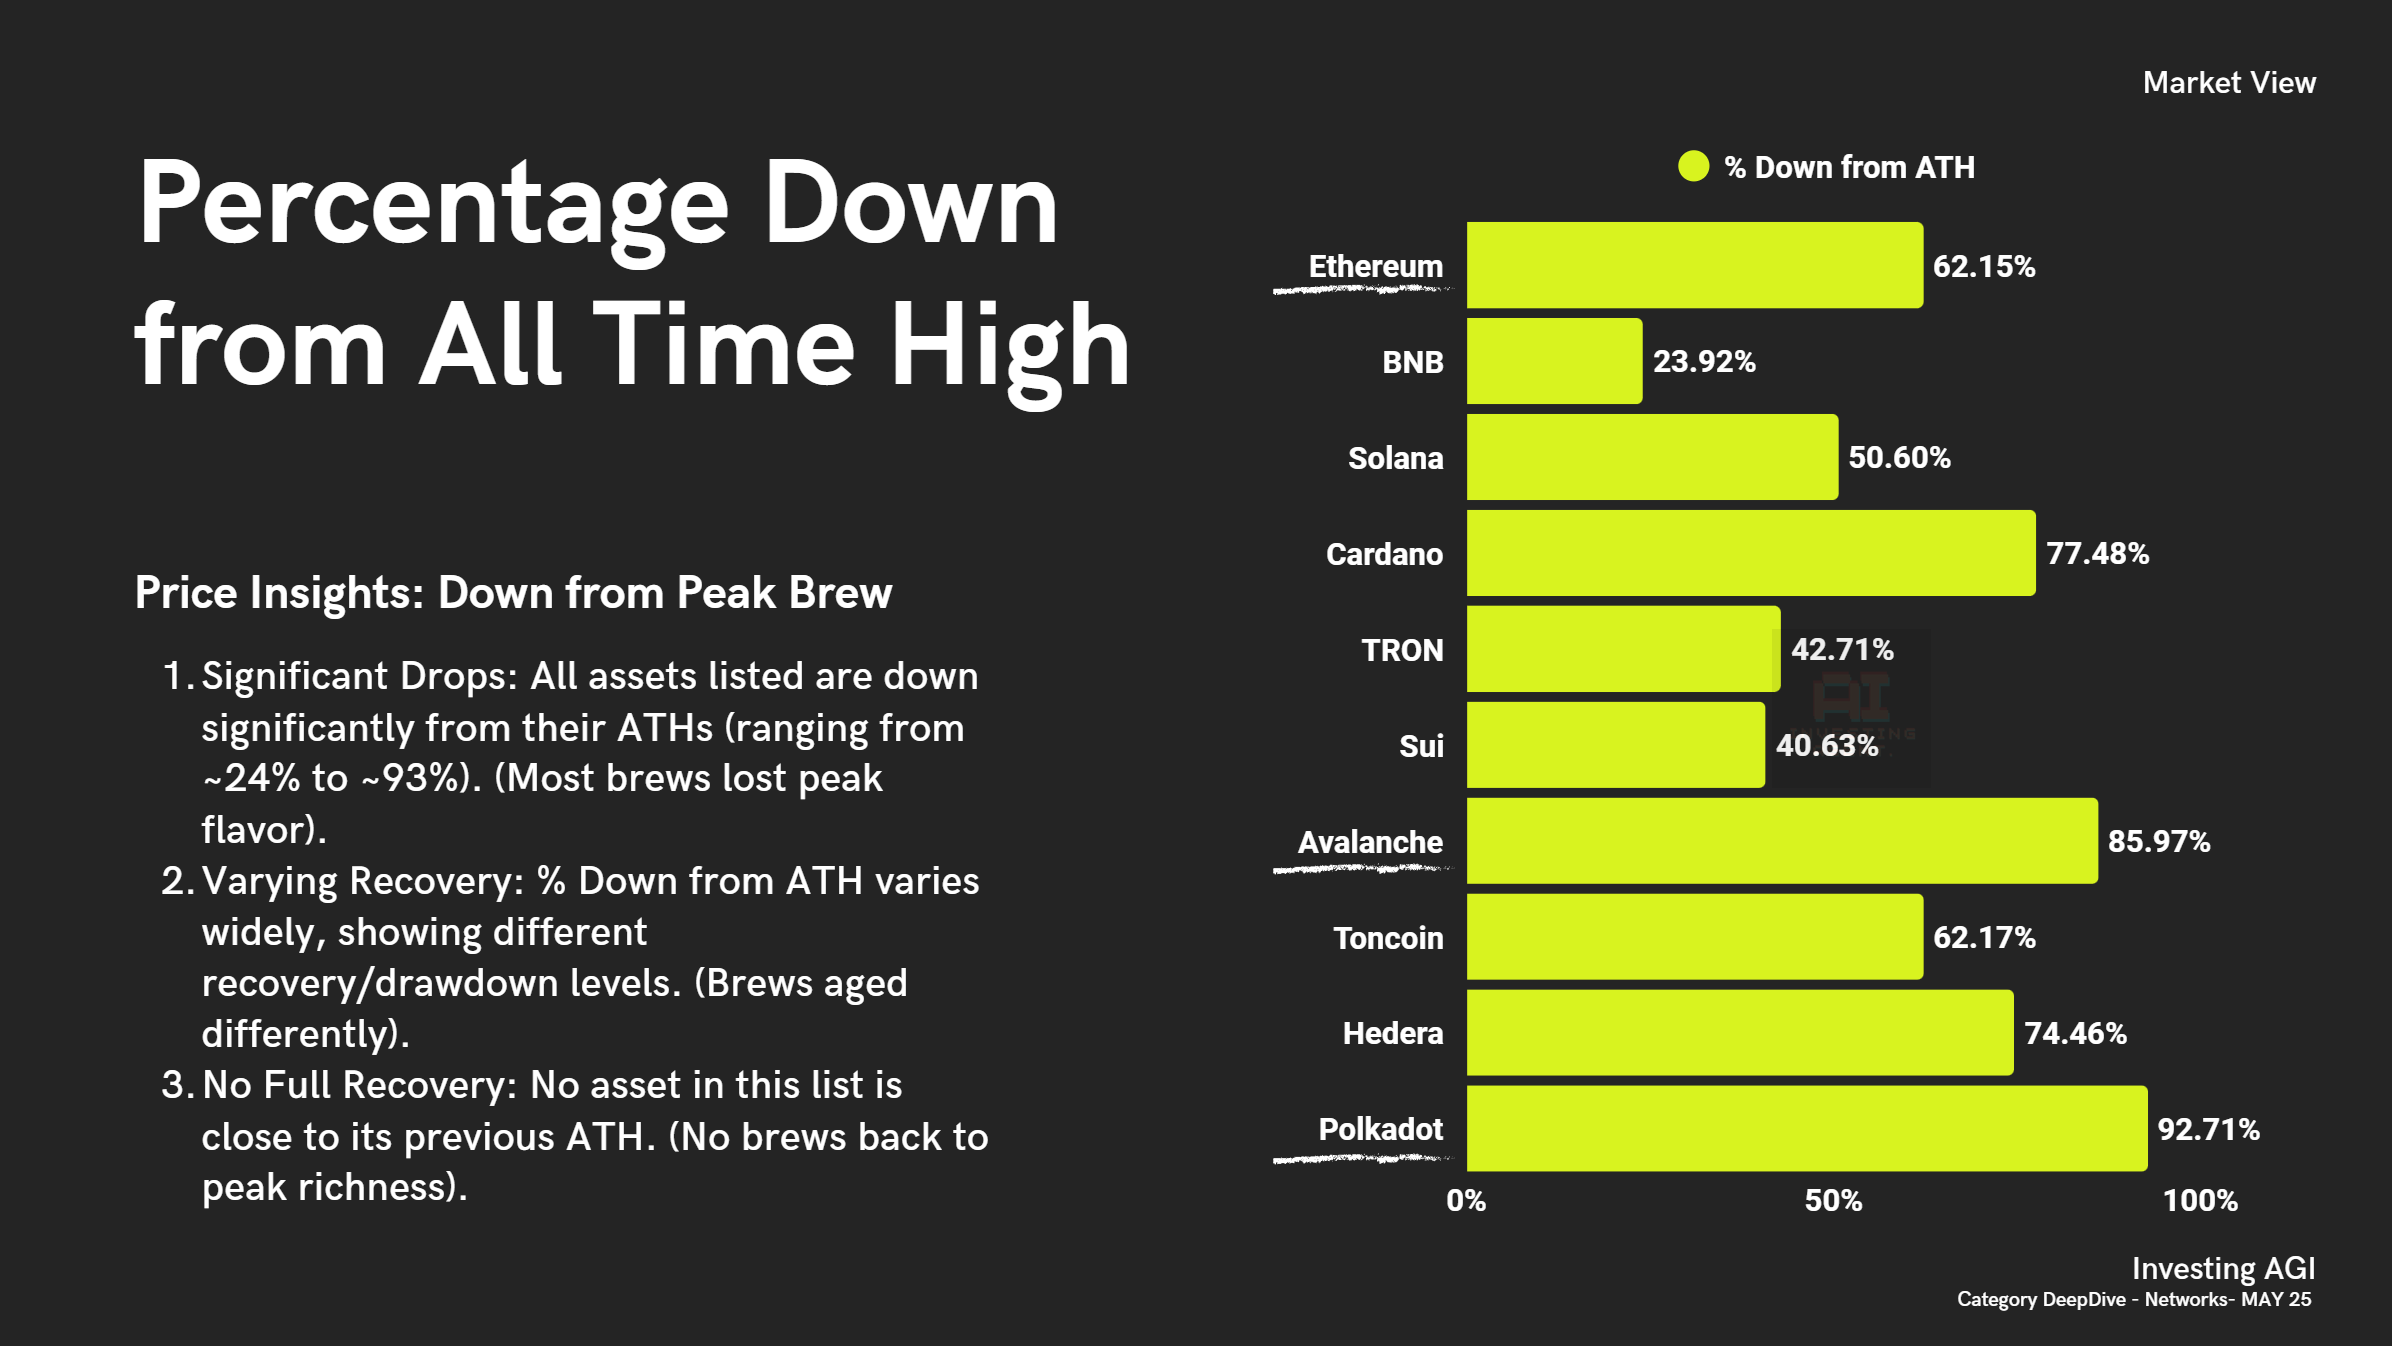
5. Percentage Down from All Time High (ATH): How Far from Peak Flavor?
This metric shows how much value assets have shed since their absolute peak prices.
Significant Drops Across the Board: As of May 2025, all listed Layer 1s were substantially down from their ATHs, ranging from BNB (~24% down) to Polkadot (~93% down). 'Most brews lost peak flavor'.
Recovery Varies: The extent of the drawdown varied significantly, showing that different 'brews aged differently' or recovered at vastly different paces from their highs.
No Full Recovery Yet: Crucially, no major Layer 1 listed was close to reclaiming its previous ATH, indicating a broad market downturn or reset from prior peaks. 'No brews back to peak richness'.
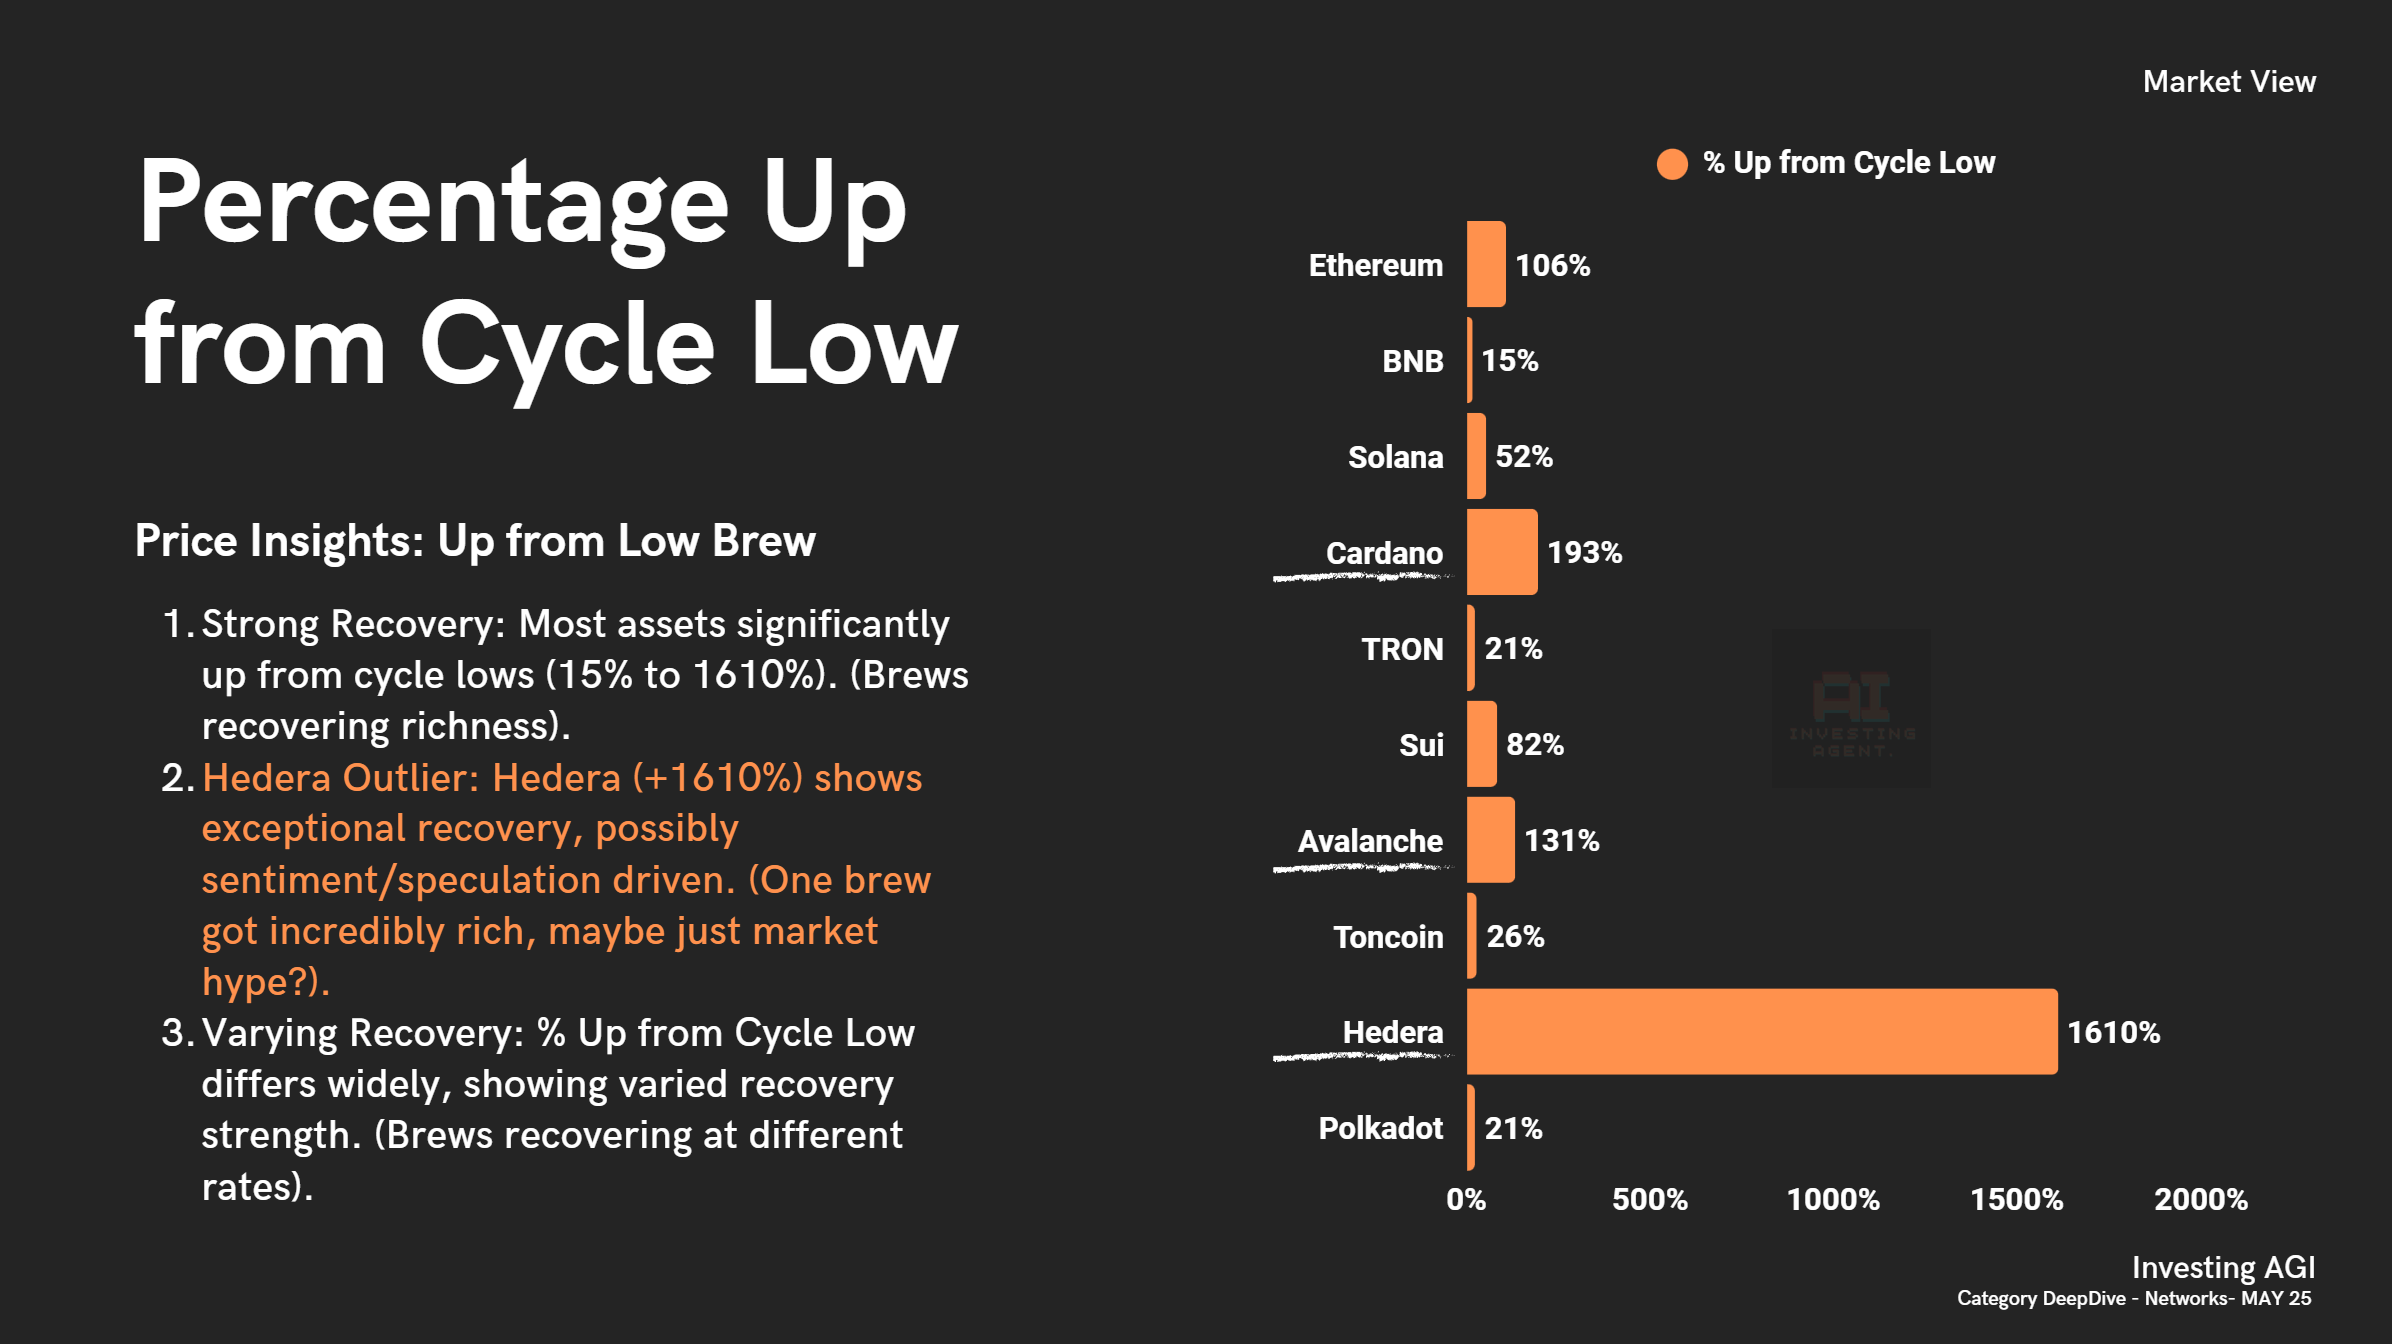
6. Percentage Up from Cycle Low: How Strong is the Comeback Brew?
This looks at the recovery strength from the bottom of the recent market cycle.
Strong Recoveries Common: Most assets showed significant gains from their cycle lows, ranging from BNB (+15%) to an astonishing Hedera (+1610%). The 'brews were recovering richness'.
Hedera's Explosive Bounce: Hedera's +1610% recovery was a massive outlier, suggesting potentially strong 'market hype' or specific narratives driving its bounce beyond the others. 'One brew got incredibly rich, maybe just market hype?'.
Uneven Rebound: Just like the drawdown, the strength of the recovery varied widely, showing that 'brews were recovering at different rates'.
Filtering the noise in the Layer 1 space requires looking beyond the headlines and tribal shouting. By focusing on the market data – the capital flows, trading activity, market access, and price performance relative to highs and lows – we get a clearer picture of the landscape. Ethereum's dominance was stark in May 2025, but the varying performance and recovery rates across other major L1s showed a dynamic and volatile market where sentiment could diverge significantly from perceived utility. This focused brew highlights the importance of data in navigating the bustling, and often chaotic, world of Layer 1 blockchains.